Rhythmic Segment Analysis
Summary
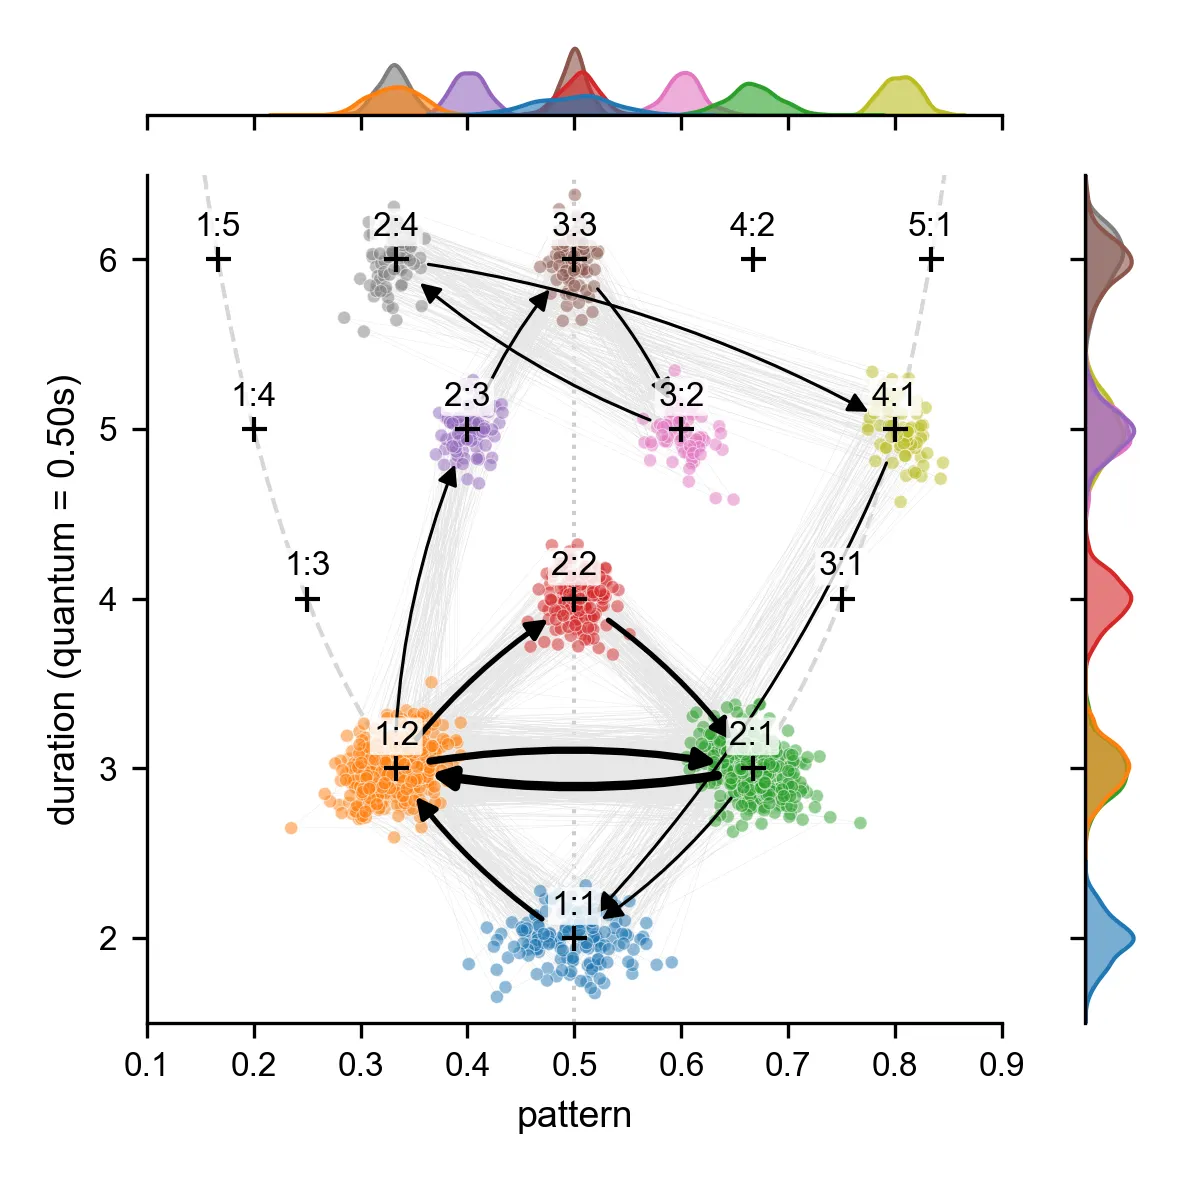
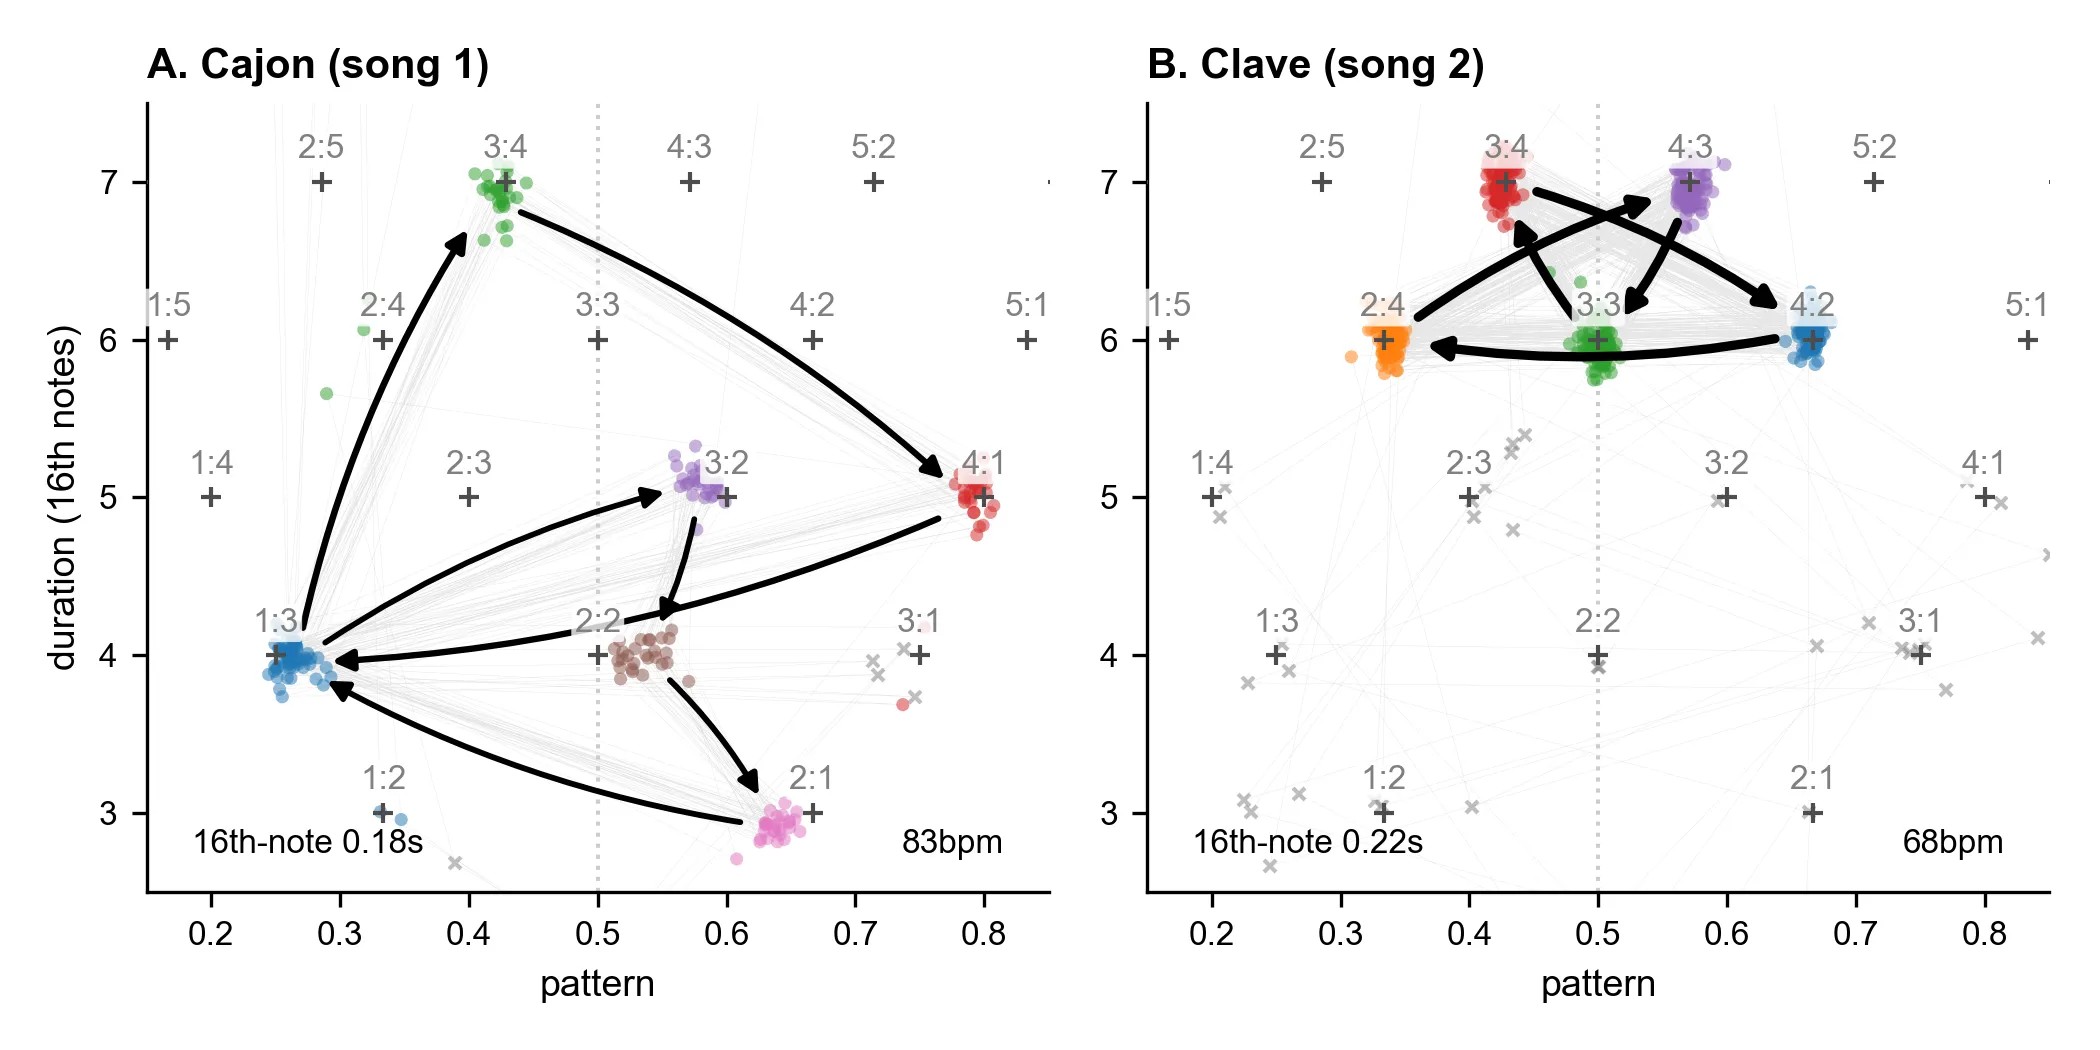
This paper addresses how to conceptualize, visualize, and measure regularities in rhythmic data. I propose to think about rhythmic data in terms of interval segments: fixed-length groups of consecutive intervals, which can be decomposed into a duration and a pattern, the latter being a point in a rhythm simplex (e.g., 1 : 1 : 2). This simple conceptual framework unifies three rhythmic visualization methods and suggests a fourth: the pattern-duration plot. When paired with a cluster transition network, it intuitively reveals regularities in both synthetic and real-world rhythmic data. Moreover, the framework generalizes two common measures of rhythmic structure: rhythm ratios and the normalized pairwise variability index (nPVI). In particular, nPVI can be reconstructed as the average distance from isochrony, and I propose a more general measure of anisochrony to replace it. Finally, the novel concept of quantal data proves to be fruitful. Referring to intervals that cluster around integer multiples of a smallest duration, it may shed light on wider debates regarding small integer ratio rhythms.